The data contained here is derived from this article authored by ChinaPower and published by the Center for Strategic & International Studies.
Click to enlarge any of the images.
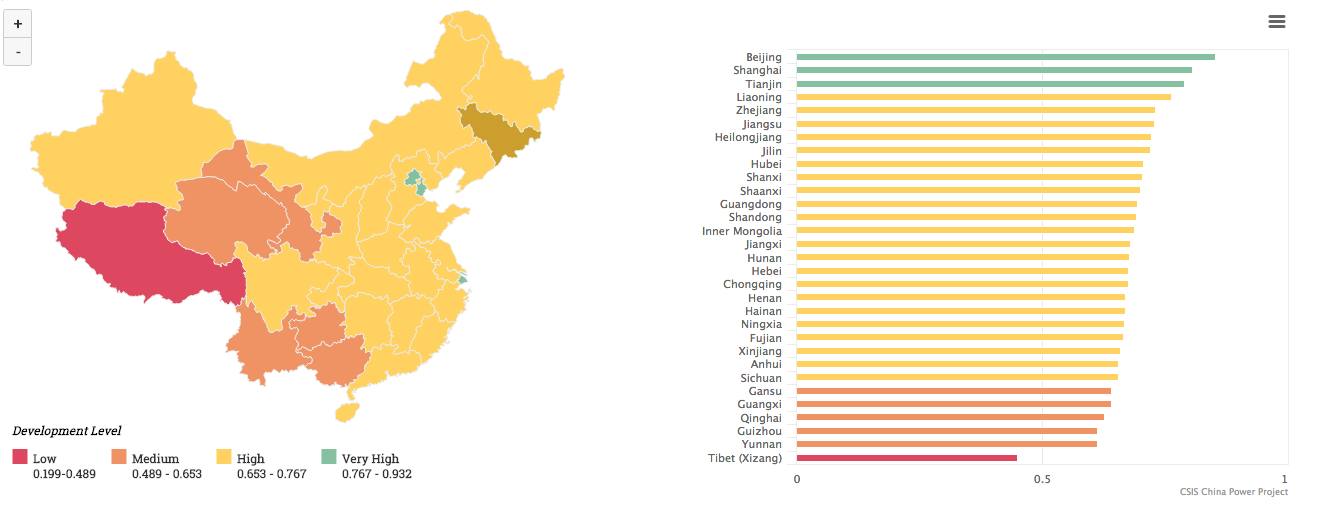
The first graph compares the regions based on educational index, a figure calculated from mean years of schooling and expected years of schooling. Rated from 0 (no educational attainment) to 1 (perfect educational attainment). Source: UNDP.
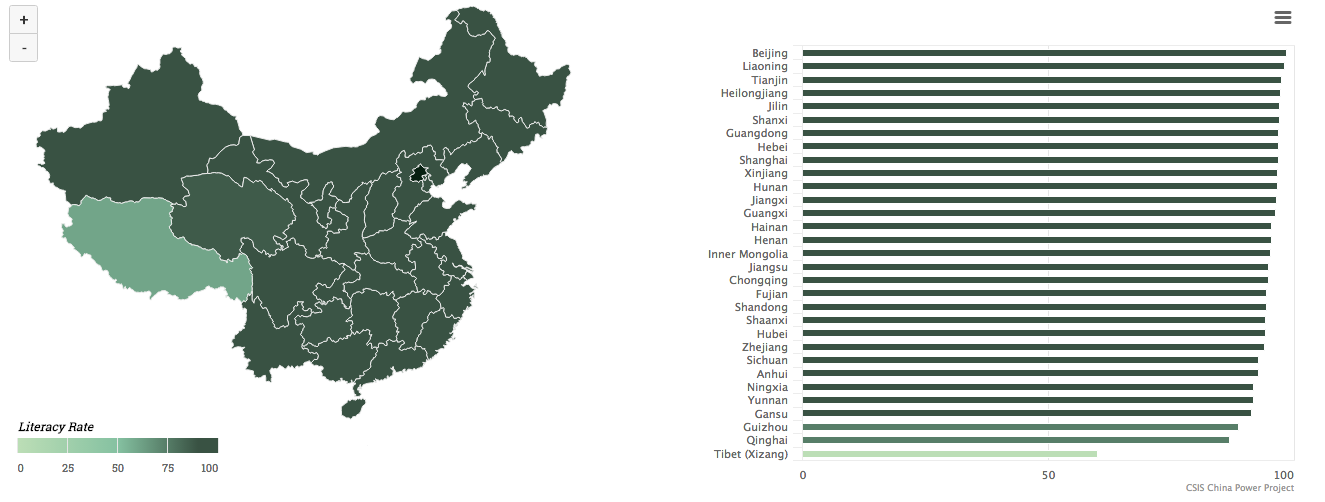
The following graph provides a provincial breakdown of literacy, and provides the percentage of the population 15+ years with the ability to read and write (Source: China Statistical Yearbook, World Bank).
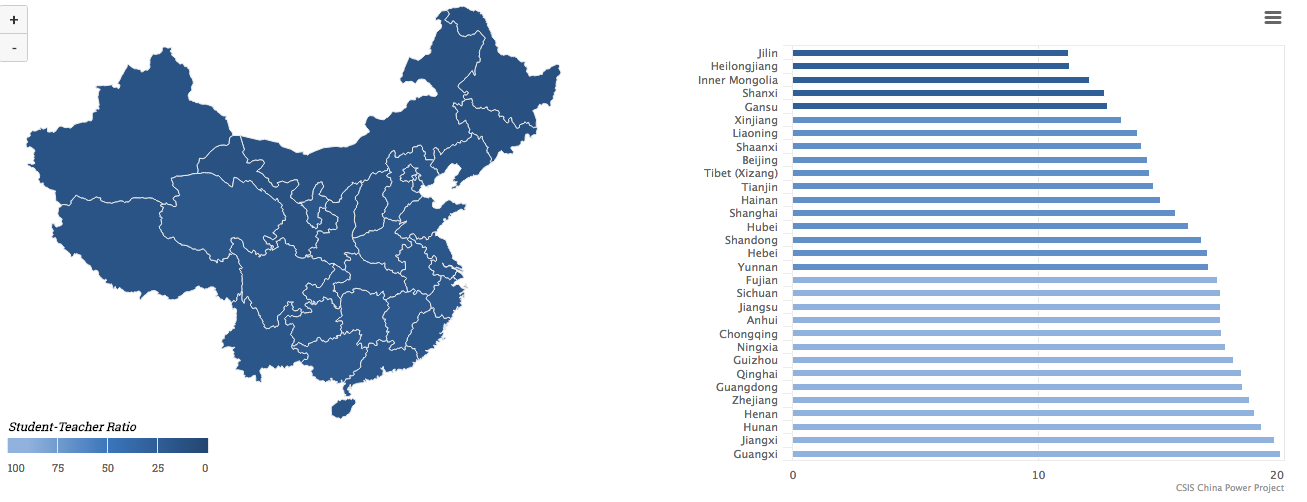
Next, a graph demonstrating the ratio of students who attend a primary educational institution divided by the number of teachers in the institution (Source: China Statistical Yearbook, UNESCO).
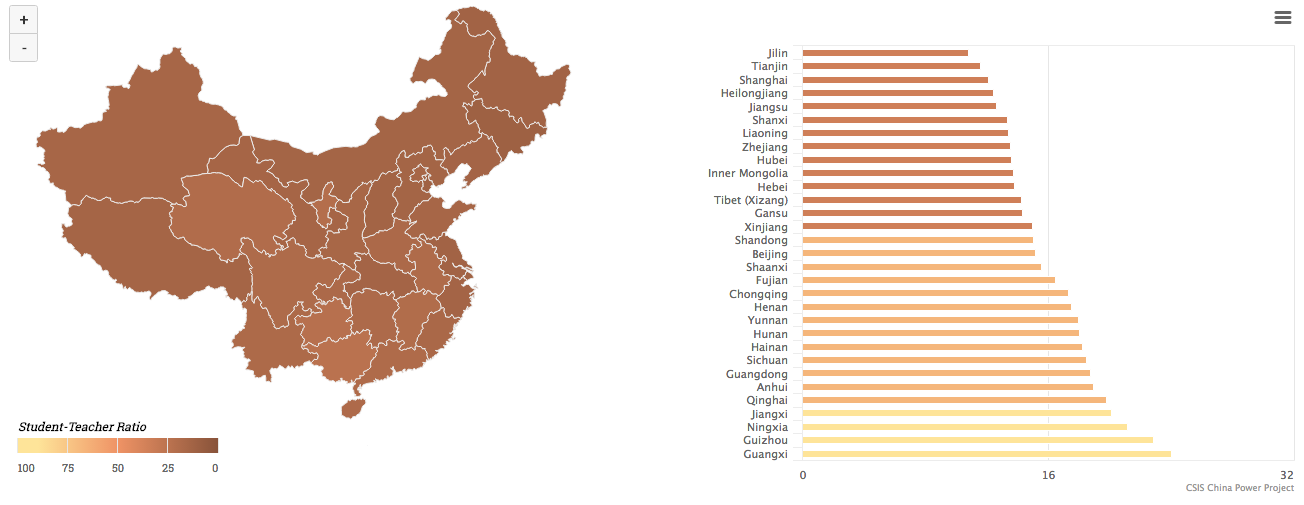
And finally, for secondary education:
This map graphically illustrates how Asia is the demographic centre of the world. And Danny Quah’s accompanying map below demonstrates how the epicentre of the global economy is relentlessly moving from its location in the western Atlantic in 1980 to its present location north of the Red Sea, and to the Indo-Chinese border by 2050.
Source: Danny Quah
Over the last decade China has become the biggest trading partner of a multitude of countries around the world. All those coloured in red count as their biggest trading partner; for those coloured orange China is the second biggest trading partner. In 1990, China was the biggest trading partner of hardly any countries in the world; and even a decade ago it was still a phenomenon overwhelmingly confined to East Asia.
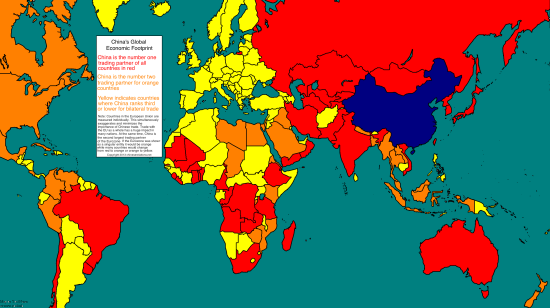
Source: chineserelations.net
According to the International Comparison Programme of the World Bank, later this year the Chinese economy will become larger than that of the United States measured by purchasing power parity. Already, by the end of 2011 it was 87% of the size of the US economy. The United States has been the world’s largest economy since 1872 when it overtook the UK. The Chinese economy had previously been expected to overtake the US economy in 2019, in other words five years later. Despite the bearish sentiments of many western commentators over the years, the Chinese economy has consistently outperformed the predictions about its rise.
 Source: FT, IMF Statistics, World Bank ICP 2011 Estimates
Recent Western commentary on the Chinese economy has been decidedly negative, emphasising the problems and downbeat about the prospects. This, of course, is hardly new: indeed it is absolutely par for the course. In fact, as the figures below show, the Chinese economy has done extraordinarily well in the five years since 2008 and the Western financial crisis. The contrast with the performance of Western economies over the same period is sobering to say the least.
- China’s GDP nearly doubled from Rmb26.6tn ($4.3tn) in 2007 to Rmb51.9tn ($9.49tn) in 2012
- Government revenue more than doubled from Rmb5.1tn to Rmb11.7tn
- Urban incomes rose by an annual average of 8.8%; rural income increased by an annual average of 9.9%
- 58.7m jobs were created in cities; 84.6m rural residents migrated to cities
- 19,700 km of new rail lines were built; 8,951 km of those were high-speed rail
- 609,000 km of new roads were built; 42,000 km were expressways
- 31 airports were built; 602 shipping berths for 10,000-ton ships were built
- The non-performing loan ratio of banks fell from 6.1% to 0.95%; their capital adequacy ratio rose from 8.4% to 13.3%
- Government spending on education increased at an average annual rate of 21.6%; spending on science and technology increased 18% a year
- Chinese investment overseas more than tripled from $24.8bn to $77.2bn
There has been much exaggerated talk about the rise of Chinese military expenditure. The first graph below gives an historical perspective. In 2012, Chinese military expenditure was less than a quarter of US military expenditure. As a proportion of GDP, China’s military expenditure was 2.0% compared with 4.4% for the US. The striking fact remains the US’s huge military expenditure. The second graph below gives the per capita military expenditure of a range of countries. As is clear, in per capita terms, China’s military expenditure remains still extremely low.
Click to expand:

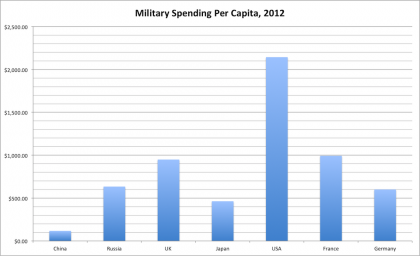
The above figures are taken from the Stockholm International Peace Research Institute’s Military Expenditure Database. For more information, refer to Xiao Tiefeng’s article at the Carnegie-Tsinghua Center for Global Policy, Misconceptions About China’s Growth in Military Spending.