The data contained here is derived from this article authored by ChinaPower and published by the Center for Strategic & International Studies.
Click to enlarge any of the images.
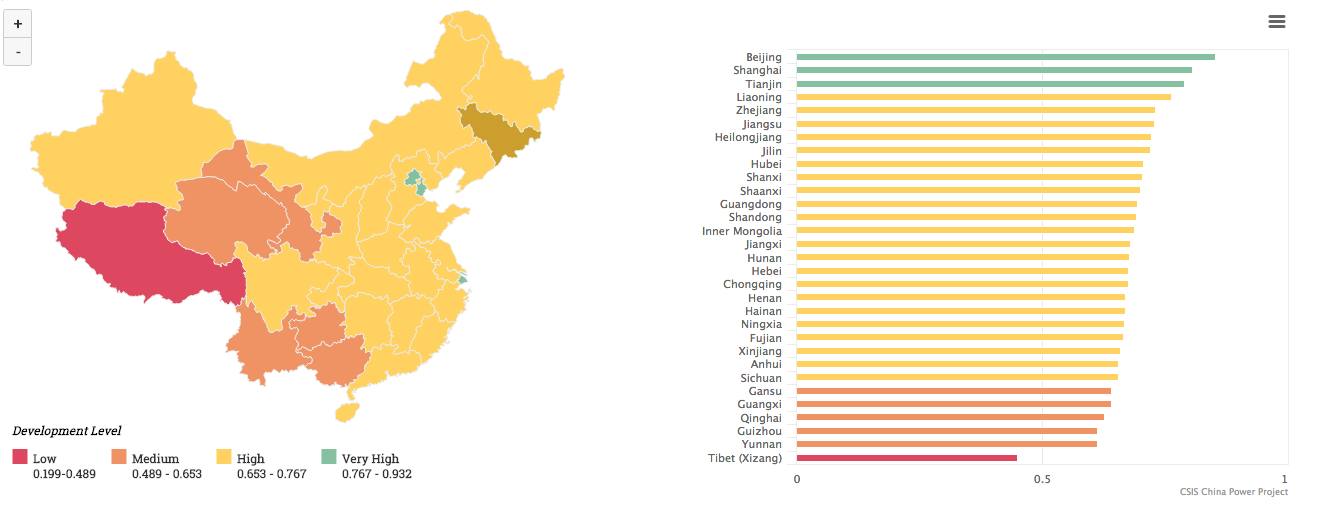
The first graph compares the regions based on educational index, a figure calculated from mean years of schooling and expected years of schooling. Rated from 0 (no educational attainment) to 1 (perfect educational attainment). Source: UNDP.
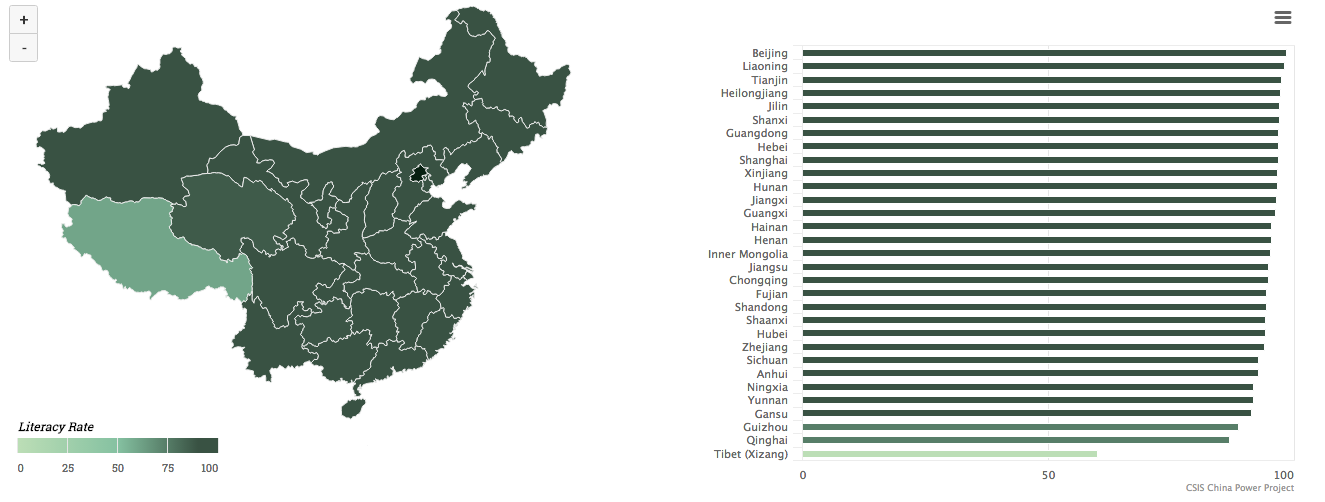
The following graph provides a provincial breakdown of literacy, and provides the percentage of the population 15+ years with the ability to read and write (Source: China Statistical Yearbook, World Bank).
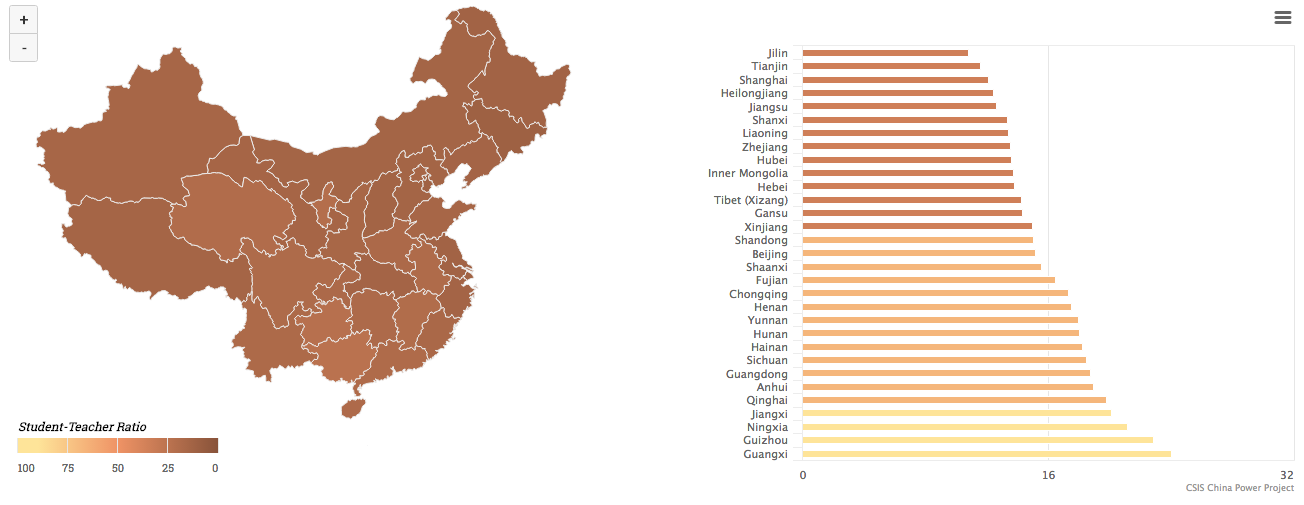
Next, a graph demonstrating the ratio of students who attend a primary educational institution divided by the number of teachers in the institution (Source: China Statistical Yearbook, UNESCO).
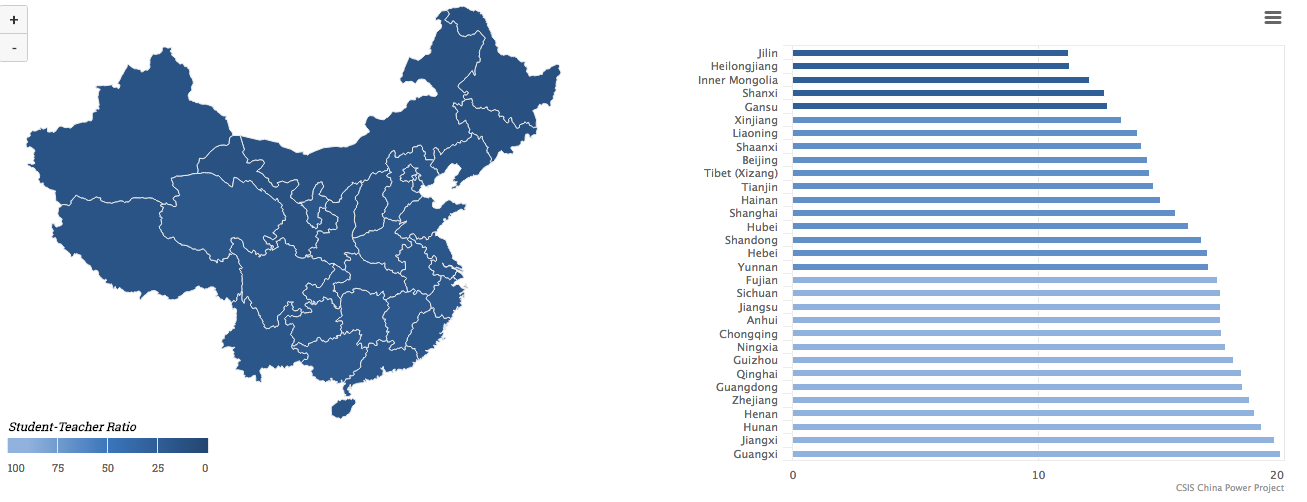
And finally, for secondary education: